
Parhelion
The digital twin of your plant
A physics-based model that knows what the plant should be producing. In blind tests it found 91% of faults and identified the correct string for 98.6% of its findings.


We watch the output and handle faults, claims and repairs. For you.
Parhelion
A physics-based model that knows what the plant should be producing. In blind tests it found 91% of faults and identified the correct string for 98.6% of its findings.

Monitoring
We compare actual output with the digital twin. You see the loss in kWh and in euros before it reaches the invoice.

Diagnostics
Parhelion shows the affected string and estimates both the likely cause and how the loss will develop over 30 to 180 days.

Claims and warranties
Measured data and technical documentation serve as evidence in dealings with the manufacturer, the installer and the insurer.

Service
We coordinate the service companies and, after each job, measure that the output has really come back. You just approve.

Independent data from more than 125 GW of plants
Plants routinely produce less than they could. Losses from faults are rising fast, and routine inspections miss some defects altogether.
5%
of output lost by a typical plant compared with the model. For 750 kWp at €0.17/kWh, that is roughly €6,600 a year.
NREL PV Fleet 2024 · 1,128 systems, 8.5 GW
+115%
rise in losses from equipment faults between 2021 and 2025, from 2.36% to 5.08% of output.
Raptor Maps, Global Solar Report 2026
79%
of high-risk connector faults have no thermal signature, so a thermal camera won't pick them up.
kWh Analytics, Solar Risk Assessment 2026
Plants inspected once a year lose around 7% of their output. With five inspections a year, it is roughly 3%.
Raptor Maps, Global Solar Report 2026. This is a correlation, not a proven cause.
Read the studyA parhelion is a rare phenomenon in which a faithful image of the sun appears beside it. That is exactly what we do with your plant.
Parhelion is the digital twin of your plant. Using the documentation and actual weather, it calculates what the plant should be producing and compares every string with its neighbours and with the model. Every difference is turned into a location, a loss in euros and a likely cause.

String-level power data from the inverters and public satellite weather data. Nothing is installed and no rooftop sensor is needed.
It takes the tilt, orientation and size from the documentation, or works them out directly from the production record. Then it calculates, hour by hour, what the plant should produce.
Every hour, each string is checked against its neighbours and against the twin. The gap becomes kilowatt-hours and money.
Which string, since when, how many kWh and the likely cause. A neural network adds tomorrow's output forecast and how the loss will grow over the next 30 to 180 days.
Verified in blind tests on 1,500 pre-registered simulated plants under real measured skies; the forecast was also tested on a real plant. Validation results
Fewer losses, lower operating costs and decisions that are calculated before you pay for them.
Results from the first real plant: 10 kW, two strings, 400 faults injected into the actual production record. We are now verifying real faults in the pilot programme.
We find faults, soiling and shading before they add up to lost years.
A slow decline that triggers no alarm shows up as a deviation from the model.
We estimate how a detected loss will develop over 30, 90 and 180 days if nothing is done about it.
We recognise an export limit, zero-export operation or an overheated inverter and don't raise needless alerts.
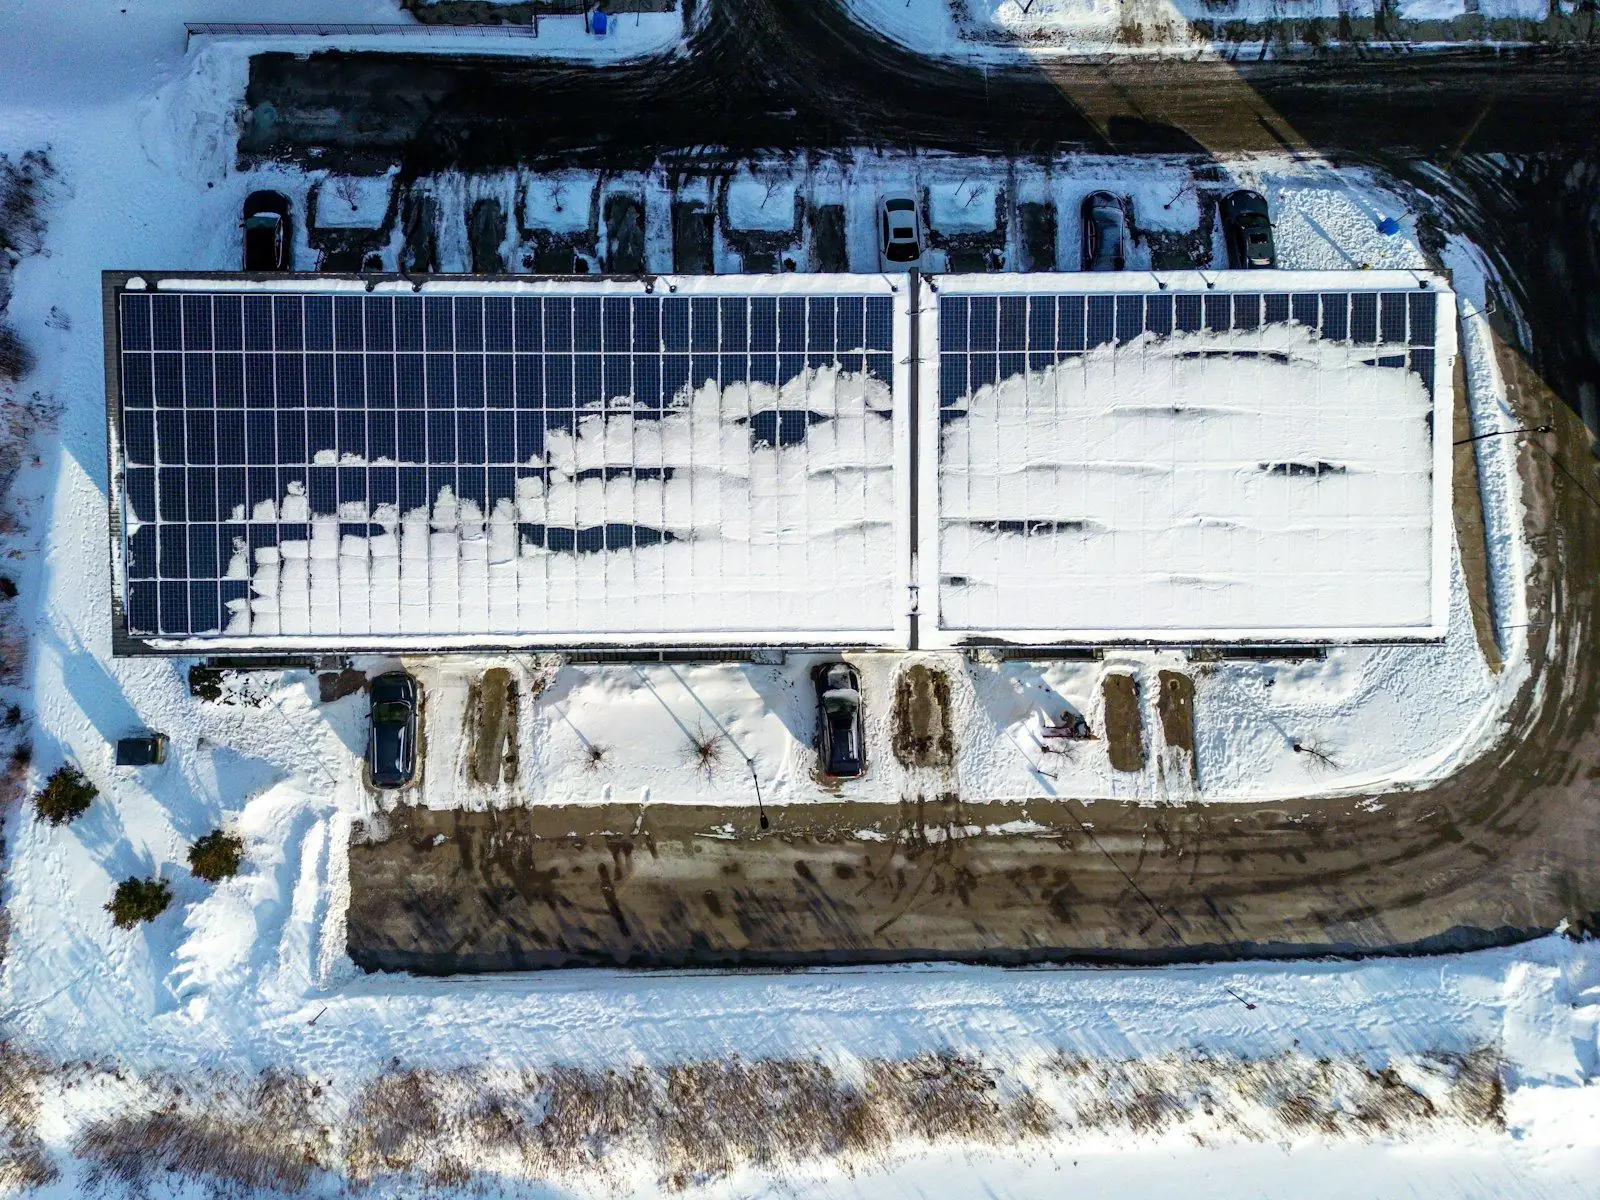
We distinguish snow, soiling that washes off or a brief outage from a fault that persists.
After a hailstorm or a gale, we compare output with the twin and show what has changed.
You pay for service when it is genuinely needed, not by the calendar.
The technician knows in advance where to go and what to bring. The repair is faster.
Cleaning, inspections and replacements are planned from data, not blindly.
We fix a small defect before it turns into an expensive repair.
After every job, we measure that output has really come back.
We handle service, claims and insurance cases. You just approve.
Finding problems, calculating losses and proposing fixes all run without any work on your part.
The software calculates the cost of the repair and its payback before you order anything.
The model calculates how the loss will grow over the next 30 to 180 days.
You know what the plant will produce tomorrow, hour by hour, with an uncertainty band.
Add modules, a battery or a fault in the virtual environment and see the impact straight away.
A better return on the plant and technical documentation for the bank, the insurer and the manufacturer.
For every finding, the software calculates the loss, the cost of the fix and the payback. The decision then takes a single click.
Most likely module soiling
A sample model of a logistics warehouse: 1,558 modules, each one in its place.
The portal shows where your plants are losing output and what it is costing the business. Our team then sees the repair, the claim and the insurance case through to the end. One partner, one point of responsibility.
No new hardware · Your data stays yours · Outputs for audits, banks and insurers
What is typically available today for 30–500 kWp plants without a service contract, and what we take on.
Source: Solar PV Underperformance 2026, sections 17 and 20.
In its third year of operation, a 30 MWp plant discovered that 15% of its modules were degrading at 2.5% a year, while the warranty allowed no more than 0.7%. The claim covered 4,500 modules and the manufacturer replaced them. The lost output was worth roughly €200,000.
Without measured data, nobody would have noticed. That is why we collect evidence continuously, handle claims with manufacturers and installers, and keep track of the deadlines.
Book a consultationA documented industry case: PV-Maps, January 2026. Manufacturers also reject claims if you cannot provide evidence of maintenance and measurements.
A quick estimate based on the model from the Solar PV Underperformance 2026 study. Enter your own figures.
From connecting the data through diagnostics to the verified repair, everything runs in one system. Parhelion tracks every string against the digital twin, converts deviations into euros and prepares the service brief, the claim documentation and the report for the bank by itself. With every plant and every repair, it becomes more accurate.
The digital twin can handle a plant of any size. But we start where losses hurt most and where nobody is dealing with them yet.
Large solar farms have a control room, homes have the manufacturer's app. Commercial roofs fall in between.
After the boom of recent years, thousands of plants sit on industrial and commercial buildings, and they are now ageing.
The company has no energy manager, and nobody keeps an eye on the plant until something obviously goes wrong.
From roughly 75–100 kWp, the recovered output reliably outweighs the cost of management.

Overheated roofs, difficult access and no technician on site.
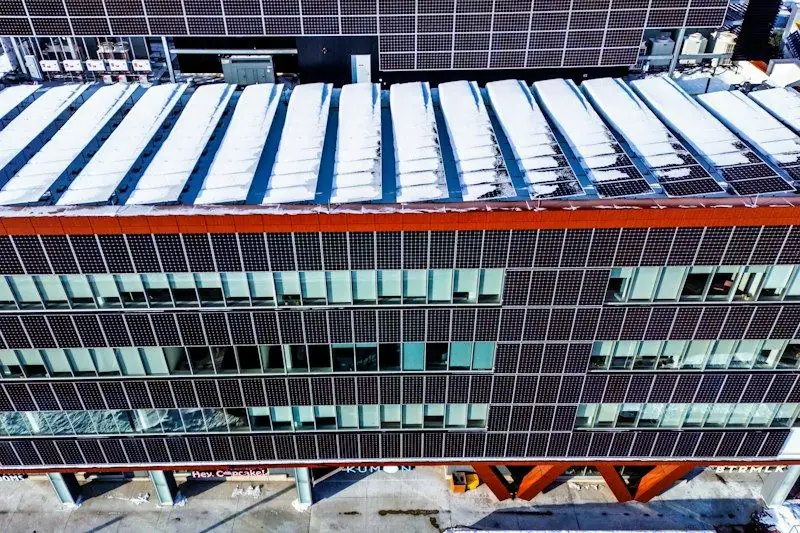
The plant is running, but nobody is accountable for its output.
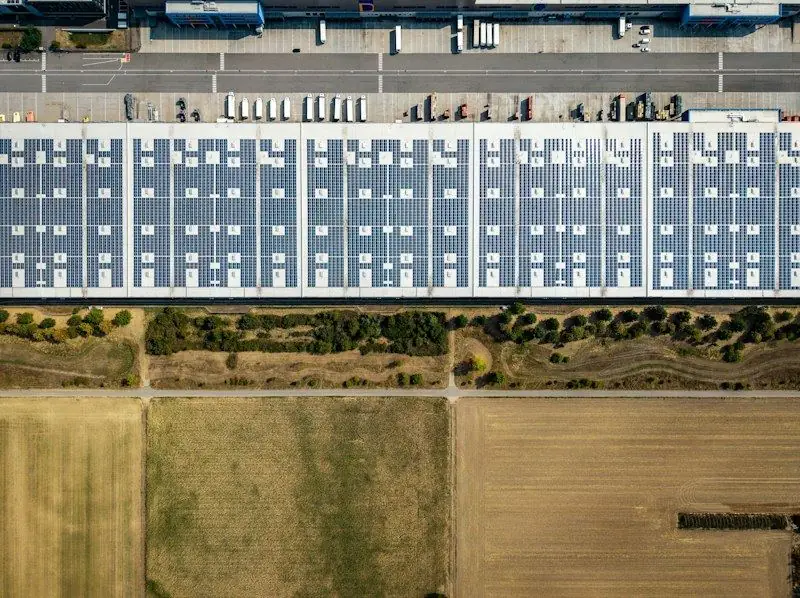
Dust and pollen increase soiling. Service is often far away.

Several sites, one overview and one partner.
A smaller plant, a solar farm or an installer? Write to us and we will tell you what makes sense.
A fifth of all output over the lifetime, once the losses from every year are added together. With occasional checks it is 11.9%, with active management 4.7%.
We will publish our own case study from the pilot programme as soon as the results are verified.
49 pages on how much solar loses, why, and what it costs. Based on data from NREL, IEA PVPS, Raptor Maps and kWh Analytics.

Pilot programme
Parhelion will monitor your plant free of charge. You get the findings and the output forecast; we get real data and your feedback.
What the service includes, how we connect to your plants and what happens to your data.
A physics-based model of your plant that uses the documentation and actual weather to calculate what the plant should be producing. If the documentation is missing, it works out the tilt, orientation and size directly from the production record. Every difference from reality is a lead to a problem: Parhelion shows the affected string, the loss in kWh and the likely cause.
For commercial and industrial plants. According to our study, the service makes the most economic sense from roughly 75–100 kWp, because only then does the recovered output reliably outweigh the cost of management. For smaller systems, we will gladly tell you whether it pays off.
We compare actual output with what the plant should have produced and look for the cause of the difference. When we find a fault, we describe it, propose a fix and arrange the repair with a service company. Afterwards, we check in the data that output has really come back.
In parallel, we track warranties and deadlines so that you can claim the defect with the manufacturer before the warranty runs out.
No. You still need your service company. We provide what is usually missing between monitoring and service: data analysis, prioritisation, the work order and the check on the result. If you have your own service provider, we work with them.
We prepare the documentation: measured data, a description of the defect and proof that the plant was properly operated and maintained. Without it, manufacturers routinely reject claims. The claim is filed by the plant owner; we manage it and keep track of the deadlines.
It still makes sense. Most lost output comes not from defects covered by the warranty but from operational issues: soiled modules, unresolved inverter errors, switched-off strings and outages dealt with too late. We handle those regardless of the warranty.
We start with the data your plant already collects: from the inverter manufacturer's portal, a datalogger or your existing monitoring. We confirm the specific brands and the connection method at the first consultation.
That is an advantage, because it gives us something to start with. Monitoring shows what the plant produces. We add what it should have produced, why there is a gap and who should fix it. You keep your existing portal.
In most cases, no. We work with the data the plant already collects. If data is missing or too coarse, we will tell you upfront and suggest what to add, whether string-level measurement or a one-off thermographic inspection.
It depends mainly on how quickly we get access to the data. Once access is granted, we build the expected-output model and a first loss overview, which we go through together.
We always begin with a pilot on your real plants, not on demo data. We connect to the production data, build the expected-output model, show you where and how much you are losing, and resolve the first losses together.
You pay nothing for the software or for our work during the pilot. In return, we ask for your feedback and real cases from operation, which guide how we develop the product.
It has no fixed duration or end date. It runs until you can see the result in the data, meaning the difference between what the plant produced before and after the fixes. For some faults that takes weeks; for seasonal issues, a whole season.
Access to the production data, the basic technical details of the plant (capacity, module and inverter types, year of commissioning) and the contact details of the person who looks after the plant on your side. If you have inspection reports, design documentation or warranty certificates, they will help us with claims.
You pay for the service companies' work, spare parts and travel, because the work is done on your property. We always price it first, though, and place the order only after you approve the quote. If the defect is covered by a warranty, we try to pass the costs on to the manufacturer or the installer.
Yes. The pilot does not commit you to anything, and either side can end it at any time. We will propose the price of any further collaboration in advance, and you do not have to continue. The data about your plant remains yours, and we will hand it over to you.
The data is visible only to authorised members of the Sunalytiq team and to the people you grant portal access to yourself. We do not sell the data or use it for any purpose other than analysing performance and handling service for your plants.
Only to the extent the job requires, and only after your approval. The service company receives the fault description and its location, not access to your whole plant or its production history.
The website and the client portal run on servers in the European Union and communicate over encrypted HTTPS. Only signed-in users can access the portal, and accounts can be protected with two-factor authentication.
We hand the data over to you and delete it on request, unless we are required by law to keep it. You will find the details in our privacy policy.
Tell us a little about your plant. We will show you where it is losing output and what we will do about it.